
U.S. Helicopter Accident Statistics: 10 Years of NTSB Data (2015-2024)
Last Updated on July 16, 2026 by Datatoys
A civil helicopter crashes in the United States roughly every 3 days. From 2015 through 2024, the National Transportation Safety Board recorded 1,178 helicopter accidents on U.S. soil. 196 of them were fatal, killing 365 people. That works out to one accident every 3.1 days, and one fatal accident about every 19 days, for ten straight years.
We pulled every U.S. civil helicopter accident from the NTSB’s public accident database and broke the decade down by year, state, and mission type. The full methodology is at the bottom of the page, and every number here traces back to the federal record.
Key findings
- The U.S. averaged 118 civil helicopter accidents and 37 deaths per year from 2015 through 2024.
- 1 in 6 helicopter accidents (16.6%) killed at least one person.
- Accidents declined about 12% from the first half of the decade to the second (626 vs 552), but deaths did not follow: 181 in 2015-2019 vs 184 in 2020-2024.
- Texas had the most helicopter accidents of any state (132), followed by California (121) and Florida (83). Together, Texas and California account for more than 1 in 5 U.S. helicopter accidents.
- Louisiana is the outlier: 34.3% of its helicopter accidents were fatal, more than double the national rate. Much of the state’s helicopter traffic is offshore transport over the Gulf.
- External load operations had the highest fatal-accident share of any common mission (23.2%). Flight training had the lowest (7.2%), despite ranking second in total accidents.
- Sightseeing helicopter crashes are rare but severe: 52 accidents killed 46 people, an average of more than 4 deaths per fatal accident, versus a national average below 2.
- Air medical helicopters logged 69 accidents and 38 deaths over the decade. Roughly 1 in 4 of those accidents was fatal.
How often do helicopters crash in the U.S.?
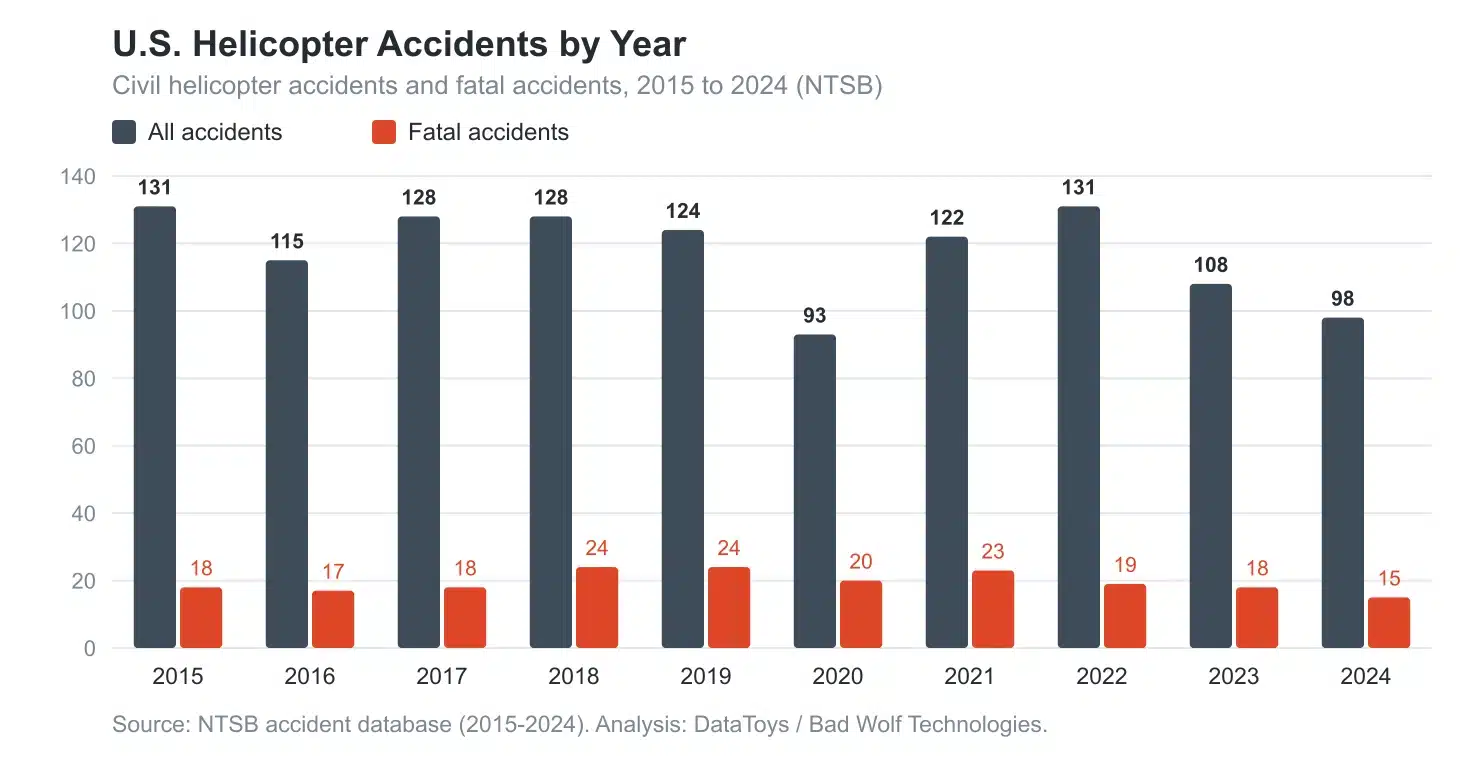
The decade’s safest-looking year was 2020, when accidents dropped to 93 as COVID grounded much of the industry. The next lowest was 2024, with 98. At the other end, 2015 and 2022 tied for the most accidents at 131, and 2018 was the deadliest year of the decade with 50 deaths.
The long-term direction is mildly encouraging on accident counts and flat on fatalities. Total accidents fell about 12% between the first and second half of the decade. Deaths did not move: 181 people were killed from 2015 through 2019, and 184 from 2020 through 2024. Fewer helicopters are crashing, but the crashes that do happen are, on average, slightly deadlier.
Which states have the most helicopter accidents?
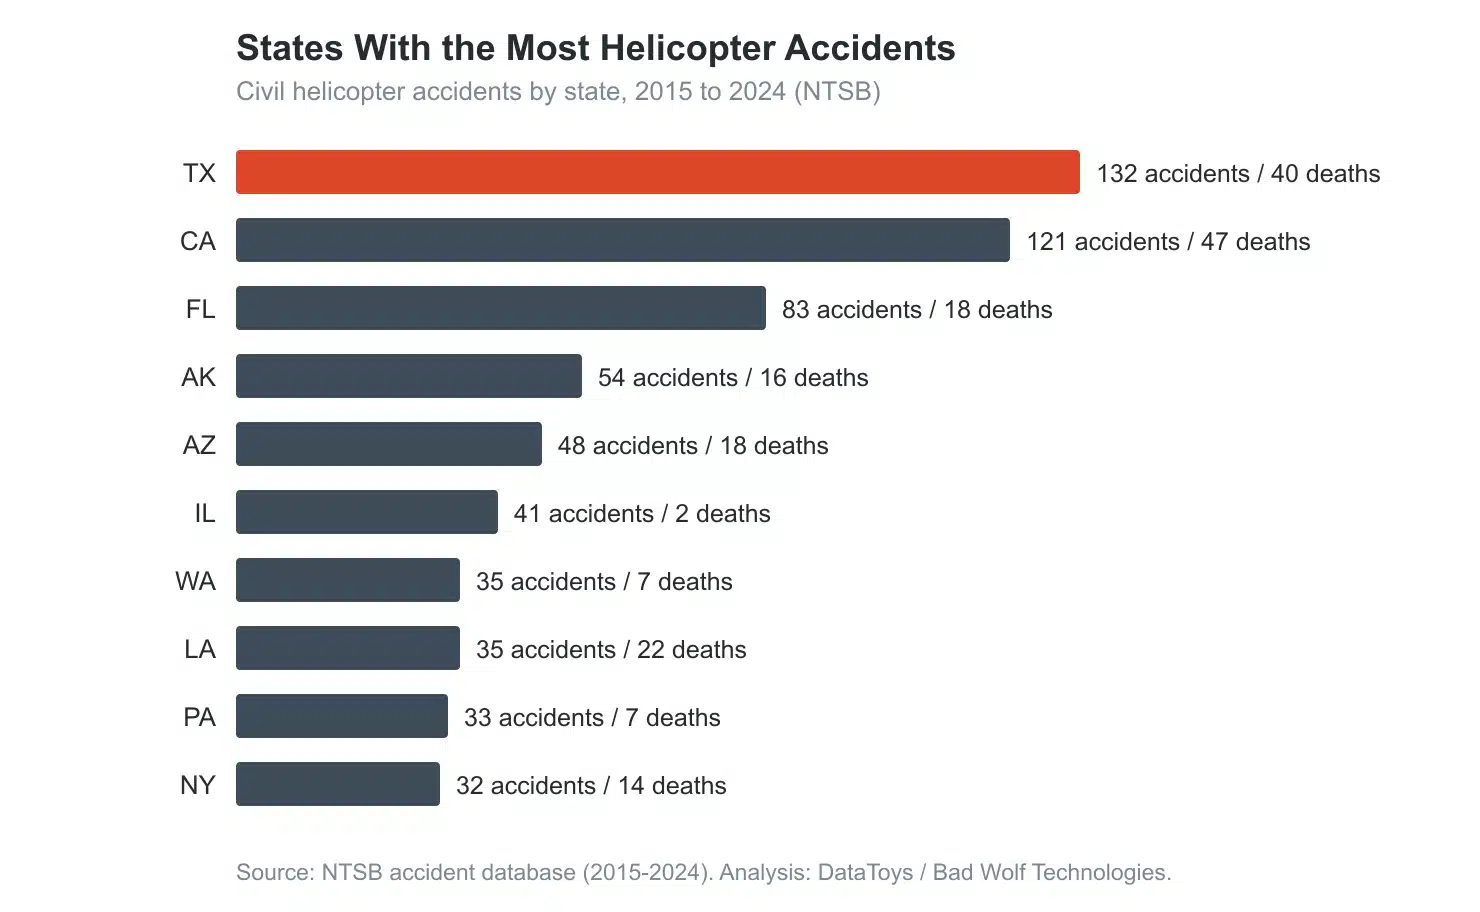
State totals track where helicopters actually fly. Texas and California have large fleets, heavy offshore and utility work, and busy training pipelines, so raw accident counts are highest there. That context matters when reading this table: a high count reflects high activity, not necessarily higher risk per flight.
| Rank | State | Accidents | Fatal accidents | Deaths | % of accidents fatal |
|---|---|---|---|---|---|
| 1 | Texas | 132 | 24 | 40 | 18.2% |
| 2 | California | 121 | 19 | 47 | 15.7% |
| 3 | Florida | 83 | 8 | 18 | 9.6% |
| 4 | Alaska | 54 | 7 | 16 | 13.0% |
| 5 | Arizona | 48 | 9 | 18 | 18.8% |
| 6 | Illinois | 41 | 2 | 2 | 4.9% |
| 7 | Washington | 35 | 5 | 7 | 14.3% |
| 8 | Louisiana | 35 | 12 | 22 | 34.3% |
| 9 | Pennsylvania | 33 | 5 | 7 | 15.2% |
| 10 | New York | 32 | 7 | 14 | 21.9% |
| 11 | Hawaii | 32 | 7 | 22 | 21.9% |
| 12 | Oregon | 31 | 5 | 6 | 16.1% |
| 13 | Nevada | 28 | 1 | 2 | 3.6% |
| 14 | North Carolina | 25 | 7 | 12 | 28.0% |
| 15 | Indiana | 24 | 4 | 4 | 16.7% |
The severity column is where the ranking gets interesting. Louisiana ties Washington for seventh place in accident count, but 12 of its 35 accidents were fatal: a 34.3% fatal share, more than double the 16.6% national average. Louisiana’s helicopter economy is dominated by offshore crew transport over the Gulf, a mission flown over open water with few forced-landing options. Hawaii shows a similar severity pattern (21.9% fatal, 22 deaths on 32 accidents), driven by its air tour industry. California’s 47 deaths are the most of any state, despite ranking second in accidents.
Which helicopter missions turn fatal most often?
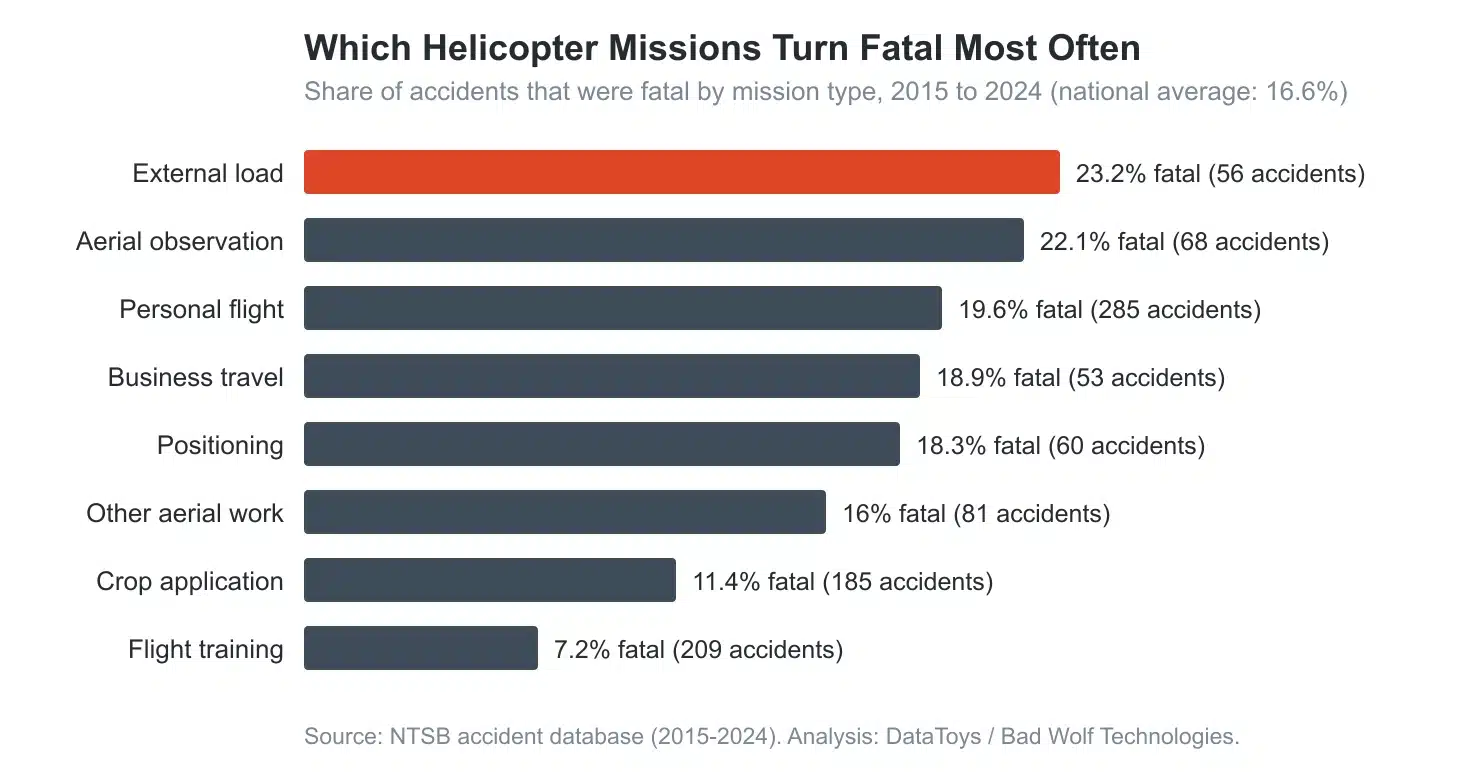
The NTSB records the purpose of each accident flight. Ranked by how often an accident kills someone, the common mission profiles separate into three tiers:
| Mission type | Accidents | Fatal accidents | Deaths | % of accidents fatal |
|---|---|---|---|---|
| External load (sling, longline, lift work) | 56 | 13 | 21 | 23.2% |
| Aerial observation (patrol, survey, news) | 68 | 15 | 31 | 22.1% |
| Personal flights | 285 | 56 | 94 | 19.6% |
| Business travel | 53 | 10 | 25 | 18.9% |
| Positioning flights | 60 | 11 | 21 | 18.3% |
| Other aerial work | 81 | 13 | 32 | 16.0% |
| Crop application | 185 | 21 | 21 | 11.4% |
| Flight training | 209 | 15 | 22 | 7.2% |
Personal flying is the volume problem: 285 accidents and 94 deaths, both the highest of any mission type, with a fatal share (19.6%) well above the national average. No other category comes close on total deaths.
External load and aerial observation are the severity problem. Both involve sustained low-altitude work, obstacles, and minimal recovery margin, and both turn fatal in more than 1 accident out of 5.
Flight training is the quiet success story in the data. Training produced 209 accidents, second only to personal flights, but just 15 were fatal (7.2%). Training accidents tend to happen at low speed, at low energy, and with an instructor aboard. Crop application shows a similar pattern at 11.4%.
The same split shows up in the operating rules. Accidents on Part 91 general aviation flights were fatal 16.0% of the time, while Part 135 air taxi and charter accidents were fatal 22.4% of the time, and Part 133 external load accidents 25.0%.
Air ambulance and sightseeing flights
Two categories the public asks about most often sit outside the table above, because the NTSB flags them separately.
Air medical helicopters were involved in 69 accidents from 2015 through 2024, and 17 of those were fatal (roughly 1 in 4), killing 38 people. Medical flights combine night operations, off-airport landing zones, and weather pressure, and the fatal share reflects it.
Sightseeing and air tour helicopters logged 52 accidents over the decade, with 11 fatal accidents killing 46 people. That is an average of 4.2 deaths per fatal accident, against a national average of 1.9. Tour aircraft fly with full cabins, so when a tour flight goes down, it rarely goes down with one person aboard. Hawaii’s numbers above are largely this category.
The deadliest U.S. helicopter accidents of the decade
Nine U.S. helicopter accidents killed five or more people between 2015 and 2024. All nine are listed here.
| Year | Location | Aircraft | Operating rule | Deaths |
|---|---|---|---|---|
| 2020 | Calabasas, California | Sikorsky S-76B | Part 135 | 9 |
| 2019 | Kekaha (Kauai), Hawaii | Airbus AS350 B2 | Part 135 | 7 |
| 2022 | Amherstdale, West Virginia | Bell UH-1B | Part 91 | 6 |
| 2024 | Halloran Springs, California | Airbus EC130 | Part 135 | 6 |
| 2016 | Pigeon Forge, Tennessee | Bell 206 | Part 91 | 5 |
| 2018 | Raton, New Mexico | Bell UH-1H | Part 91 | 5 |
| 2018 | Peach Springs, Arizona | Airbus EC130 B4 | Part 135 | 5 |
| 2018 | New York City, New York | Airbus AS350 B2 | Part 91 | 5 |
| 2021 | Palmer, Alaska | Airbus AS350 B3 | Part 135 | 5 |
Every accident in this table has a public NTSB investigation docket. The 2020 Calabasas crash, which killed all nine aboard including Kobe Bryant, remains the deadliest U.S. helicopter accident of the past decade. Five of the nine were Part 135 commercial flights carrying passengers, a list that includes charters, air tours, and a heli-ski operation.
Methodology
Source data is the National Transportation Safety Board’s public aviation accident database (data.ntsb.gov/avdata), downloaded July 14, 2026. We counted events meeting all of the following criteria: classified by the NTSB as accidents (incidents excluded), occurring in the United States, involving at least one manned helicopter, from January 1, 2015 through December 31, 2024.
Unmanned aircraft are excluded. Death counts are event-level totals and include people killed on the ground. Multi-aircraft events count once. Mission type reflects the NTSB’s recorded purpose-of-flight for the accident helicopter; events with no recorded purpose are omitted from the mission table.
Figures for the most recent years may shift slightly as open NTSB investigations close. State counts are raw totals and are not normalized for flight hours or fleet size, which the federal government does not publish at the state level.
This page is updated when the NTSB finalizes each new year of data.
What this means for operators
We build video systems for the mission profiles in the tables above, so we read this data with a practical eye. Three patterns stand out.
First, most accident helicopters carry no recording equipment at all. When the NTSB reviewed the 185 turbine helicopter accidents it investigated between 2005 and 2017, 86% of the aircraft had no onboard recorder of any kind.
The Board has recommended crash-resistant recorder systems that capture cockpit audio and images for turbine helicopters since 2013 (Safety Recommendations A-13-12 and A-13-13), and the FAA has so far declined to mandate them. Operators who want that capability today install it themselves.
That is the market we serve with cockpit video recorders and mission debriefing systems, and the highest-severity missions in the tables above (external load, aerial observation, offshore transport) are where post-flight review earns its keep.
Second, flight training’s low fatal share is not an accident. Training operations are built around review and correction, and flight training recording extends that loop: a student’s full flight, recorded in HD with audio, becomes teaching material instead of memory.
Third, the tour segment’s severity numbers argue for documentation. Flight tour video systems exist to sell souvenir footage, but the same solid-state recorders provide an objective record of every flight, which matters to the operators, insurers, and regulators reading pages like this one.
Need a recording system for one of these missions? Contact us and we will reach out to you ASAP.
Cite this page
This analysis is free to reference. Attribute it to DataToys with a link:
Source: DataToys analysis of NTSB accident data, 2015-2024. https://www.datatoys.com/helicopter-accident-statistics/
Last updated: July 2026. Data window: January 1, 2015 through December 31, 2024.